THE WORLD IN 2050
![]()
![]()
Summary
In March 2006 we produced a report setting out projections for potential growth in GDP in 17 leading economies over the period to 2050. These projections were updated in March 2008 and we are now revisiting them again in the aftermath of the global financial crisis, extended now to cover all G20 economies.
Our key conclusion is that the global financial crisis has further accelerated the shift in global economic power to the emerging economies. Measured by GDP in purchasing power parity (PPP) terms, which adjusts for price level differences across countries, the largest E7 emerging economies seem likely to be bigger than the current G7 economies by 2020, and China seems likely to have overtaken the US by that date. India could also overtake the US by 2050 on this PPP basis.
If instead we look at GDP at market exchange rates (MERs), which does not correct for price differences across economies but may be more relevant for practical business purposes, then the overtaking process is slower but equally inexorable. The Chinese economy would still be likely to be larger than that of the US before 2035 and the E7 would overtake the G7 before 2040. India would be clearly the third largest economy in the world by 2050, well ahead of Japan and not too far behind the US on this MER basis.
In many ways this renewed dominance of China and India, with their much larger populations, is a return to the historical norm prior to the Industrial Revolution of the late 18th and 19th centuries that caused a shift in global economic power to Western Europe and the US – this temporary shift in power is now going into reverse.
This changing world order poses both challenges and opportunities for businesses in the current advanced economies. On the one hand, competition from emerging market multinationals will increase steadily over time and the latter will move up the value chain in manufacturing and some services (including financial services given the weakness of the Western banking system after the crisis).
At the same time, rapid growth in consumer markets in the major emerging economies associated with a fast growing middle class will provide great new opportunities for Western companies that can establish themselves in these markets. These will be highly competitive, so this is not an easy option – it requires long term investment – but without it Western companies will increasingly be playing in the slow lane of history if they continue to focus on markets in North America and Western Europe.
This applies not least to the UK, which currently sells only around 7% of its exports to the BRICs (even including Hong Kong as part of China), about the same as it exports to Ireland at present. If the UK is to achieve trend growth of more than about 2% in the long run, then it needs to find a way to break into these fast-growing emerging markets on a much larger scale than achieved so far.
2.Approach
We began by collecting data on GDP at purchasing power parities (PPPs1) and at market exchange rates (MERs) for 2009 from the World Bank. We included all of the current G20 economies, plus Vietnam and Nigeria. The latter two countries are currently outside the top 20 economies ranked by GDP, but have strong long-term growth potential that makes them worth including in such an analysis.
We use World Bank data up to 2009 and our own short term projections for real GDP growth between 2009 and 2014 and estimated long-term trend growth from 2015 to 20502. These longer term trend growth estimates are based on the same model as used in our 2006 and 2008 World in 2050 reports and described in more detail there, but with updated data3. The essence of the model is that long-term trend growth is driven by the following key factors:
- Growth in the labour force of working age (based on the latest UN population projections).
- Increases in human capital, proxied here by average education levels across the adult population.
- Growth in the physical capital stock, which is driven by capital investment net of depreciation.
- Total factor productivity growth, which is driven by technological progress and catching up by lower income countries with richer ones by making use of their technologies and processes.
The emerging economies have stronger potential growth than the established OECD economies on most of these measures, although it should be stressed that this assumes they continue to follow broadly growth friendly policies. In this sense, the projections are of potential future GDP if such policies are followed, rather than predictions of what will actually happen, bearing in mind that some countries may not be able to sustain such policies in practice.
There are, of course, also many other uncertainties surrounding these long-term growth projections, so more attention should be paid to the broad trends indicated rather than the precise numbers quoted in the rest of this report. The broad conclusions reached on the shift in global economic power from the G7 to the E7 emerging economies should, however, be robust to these uncertainties, provided that there are no catastrophic shocks that derail the overall global economic development process.
PPPs vs. market exchange rates
GDP at PPPs is a better indicator of average living standards or volumes of outputs or inputs, because it corrects for price differences across countries at different levels of development. In general, price levels are significantly lower in emerging economies so looking at GDP at PPPs narrows the income gap with the advanced economies compared to using market exchange rates.
However, GDP at MERs is a better measure of the relative size of the economies from a business perspective, at least in the short term. For long run business planning or investment appraisal purposes, it is crucial to factor in the likely rise in real market exchange rates in emerging economies towards their PPP rates. This could occur either through relatively higher domestic price inflation in these emerging economies, or through nominal exchange rate appreciation, or (most likely) some combination of both of these effects.
When estimating GDP at market exchange rates in 2050, a similar methodology is therefore adopted as in the original World in 2050 report where market exchange rates are converging to PPP rates with different converging factors depending on the type of economy. This leads to projections of significant rises in real market exchange rates for the major emerging market economies due to their higher productivity growth rates, although these projected MERs still fall some way below PPP levels in 2050 for the least developed emerging markets.
For the OECD economies, we assume that real exchange rates converge very gradually to their PPP rates at a steady pace over the period from 2009 to 2050. This is consistent with academic research showing that purchasing power parity does hold in the long run, at least approximately, but not in the short run.
3.Relative size of economies
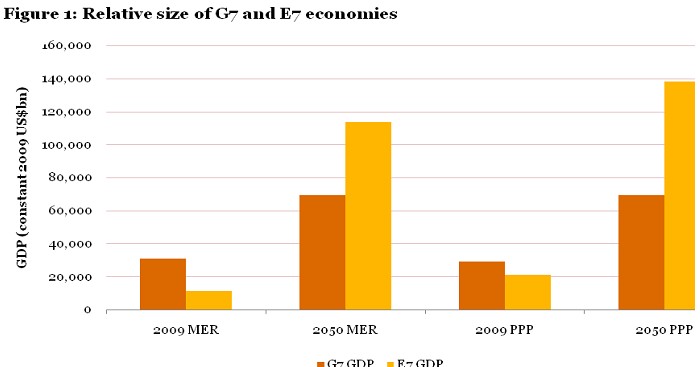
In our base case projections, the E7 economies will by 2050 be around 64% larger than the current G7 when measured in dollar terms at market exchange rates (MER), or around twice as large in PPP terms. This is a significantly larger gap than in our original 2006 report owing to the stronger growth of the E7 economies relative to the G7 through the period of the financial crisis, which to some extent has caused us to revise up also our longer term estimates of trend growth in the E7 relative to the G7.
In contrast, the E7 is currently only around 36% of the size of the G7 at market exchange rates and around 72% of its size in PPP terms (see Figure 1 below).
Below we start by reviewing the results for GDP at PPPs and then go on to consider results for GDP at MERs. The final part of this section compares the PPP and MER results in more detail and looks at how the dates at which individual E7 economies overtake particular G7 economies occur much later when comparing GDP in terms of MERs rather than PPPs.
GDP at PPPs projections
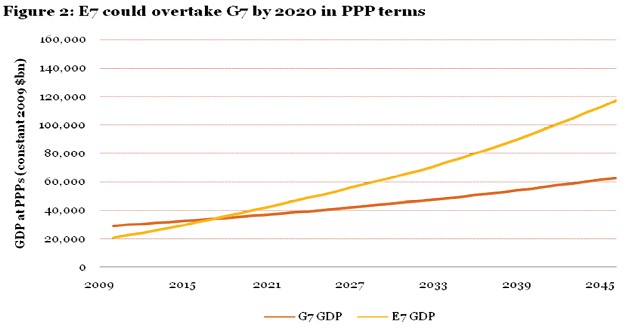
Looking at Figure 2, we can note that:
- There has been rapid convergence between the E7 and the G7 in recent years, accelerated by the global financial crisis. In 2007, total G7 GDP at PPPs was still around 60% larger than total E7 GDP. By 2010, we estimate the gap had shrunk to only around 35%.
- The catch-up process is set to continue over the next decade: by 2020 total E7 GDP at PPPs could already be higher than total G7 GDP, although any difference would still be within the margin of error of such projections.
- In the following decade from 2020 to 2030, however, the process of overtaking is likely to be reinforced, with total E7 GDP projected to be around 44% higher by 2030 than total G7 GDP in PPP terms. The gap would widen further beyond that, with the E7 almost twice as large as the G7 by 2050 in PPP terms.
The key drivers of the E7’s growth are China and India, although the former’s growth will slow down progressively due to its significantly lower labour force growth arising from its one child policy. India’s growth will remain fairly strong even in the last decade of our projections. Despite China’s slowdown in growth, it is expected to overtake the US as the world’s largest economy (measured by GDP at PPPs) sometime before 2020.
Table 1: GDP at PPPs rankings
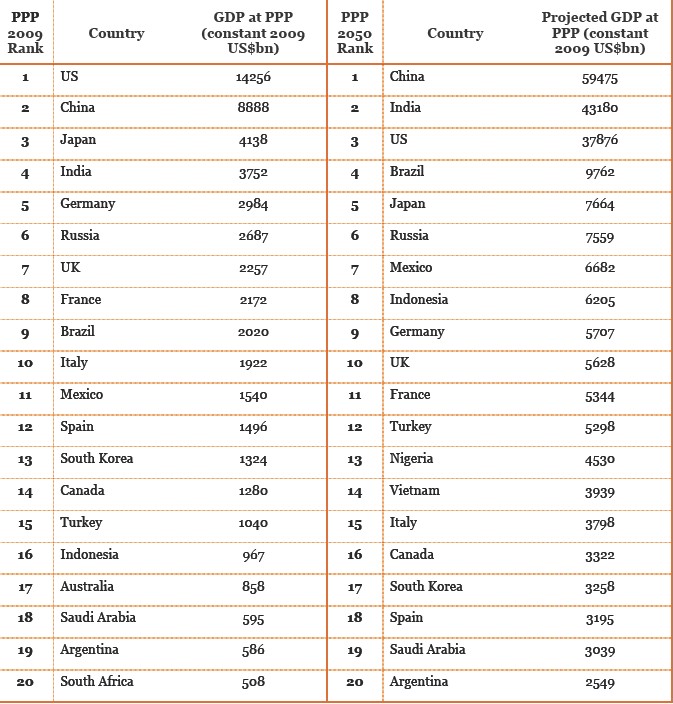
Source: World Bank estimates for 2009, PwC model estimates for 2050
Table 1 above shows the summary of GDP projections for 2050 measured at PPPs. The most notable changes compared to the 2009 position are China and India rising to the top 2 positions above the US by 2050. The next notable change in the rankings is Brazil rising above Japan in GDP at PPP terms. Additionally, Indonesia could potentially rise significantly in the rankings to eighth place by 2050.
South Africa and Australia are projected to exit the top 20 PPP rankings by 2050, while Nigeria and Vietnam are expected to enter the top 20 rankings at 13th and 14th respectively by 2050 (assuming they can continue to follow broadly growth-friendly policies – whether they will fully realise their long-term economic potential remains to be seen).
The UK, as would be expected given it is a relatively mature advanced economy, is projected to fall in the GDP rankings, but should just about remain in the top ten in 2050.
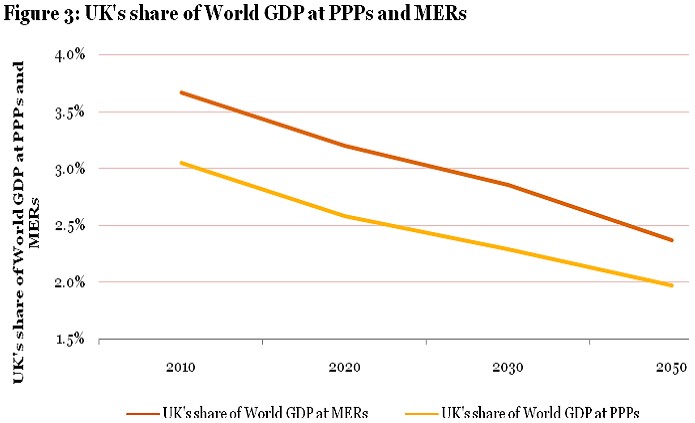
The UK, in common with other large European economies, is projected to see its share of world GDP fall gradually over the next 40 years. Figure 3 above shows the gradual fall of the UK’s share of world GDP at PPPs over the period. A similar trend is observed in the UK’s share of world GDP at MERs with the gap between the two lines slowly closing (as one would expect due to the market exchange rates converging slowly to the PPP rates).We discuss projections for GDP at MERs for all countries further below.
The UK might do somewhat better than our projections suggest if it can fully seize the opportunities provided by the fast-growing emerging markets. The UK currently heavily relies on exporting to the US and the EU, while a small share of exports are going towards the BRICs (only around 7%4 in 2009 even including Hong Kong as part of China – this was about the same as the share of UK exports going to Ireland in 2009). If increased trade and investment between the UK and the E7 economies can be achieved, the UK economy and consumers can benefit from the high growth of the emerging economies and might do somewhat better than our projections suggest, although the UK will still not be able to grow as quickly as the emerging economies themselves.
Return